

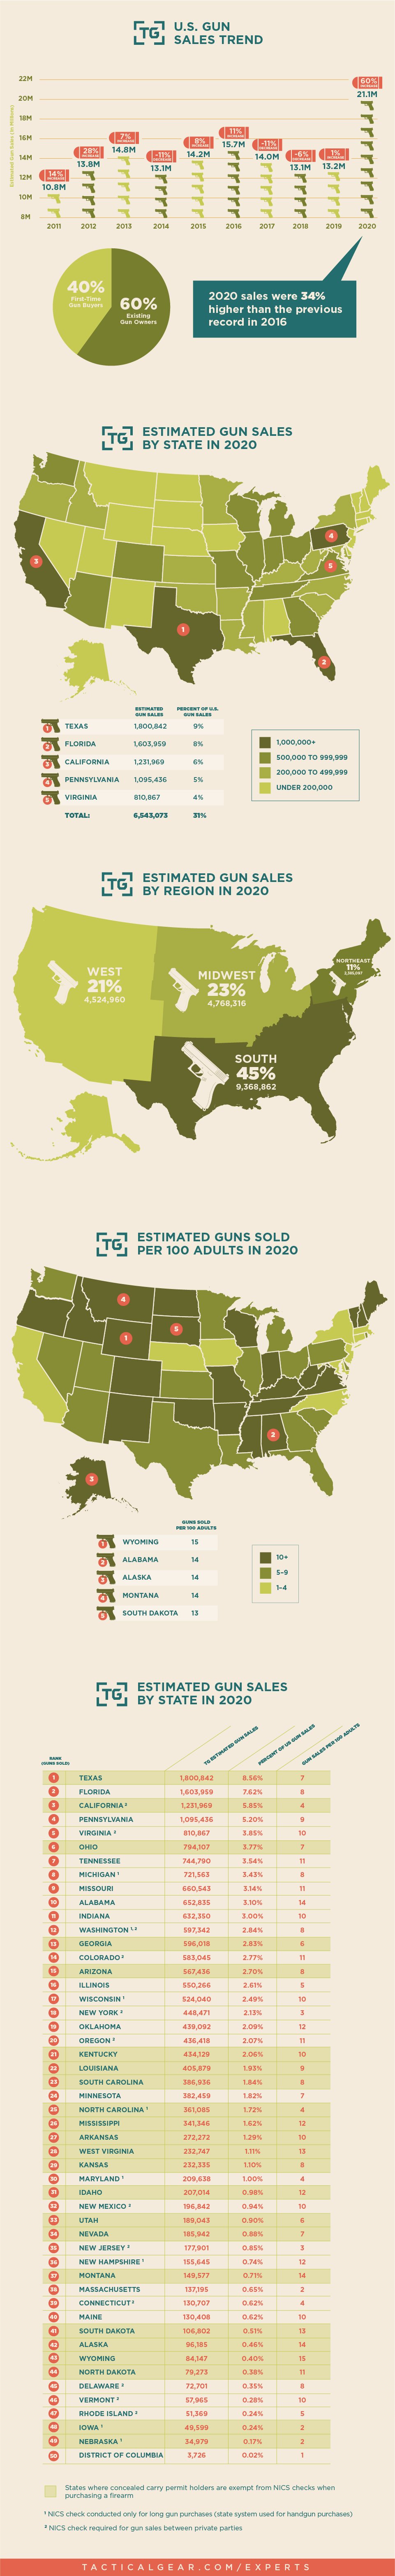
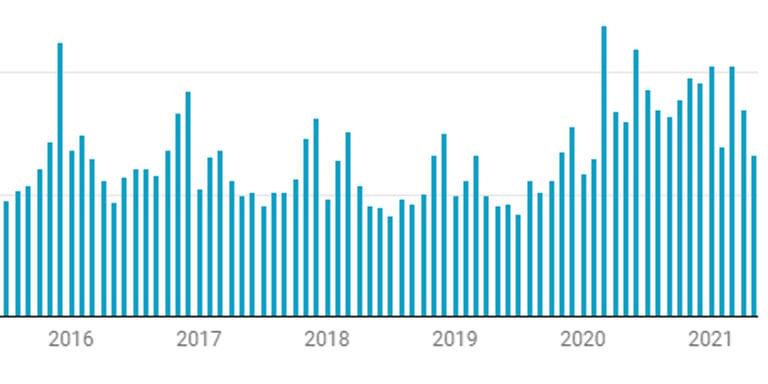
In the year 2020, more guns were sold in the United States than ever before. A lot of factors contributed to these record-breaking sales, including the COVID-19 pandemic and an incoming administration that has signaled plans to tighten gun laws. Using data from the FBI's National Instant Criminal Background Check System (NICS), we've analyzed the numbers to provide some deeper insights into the trend.
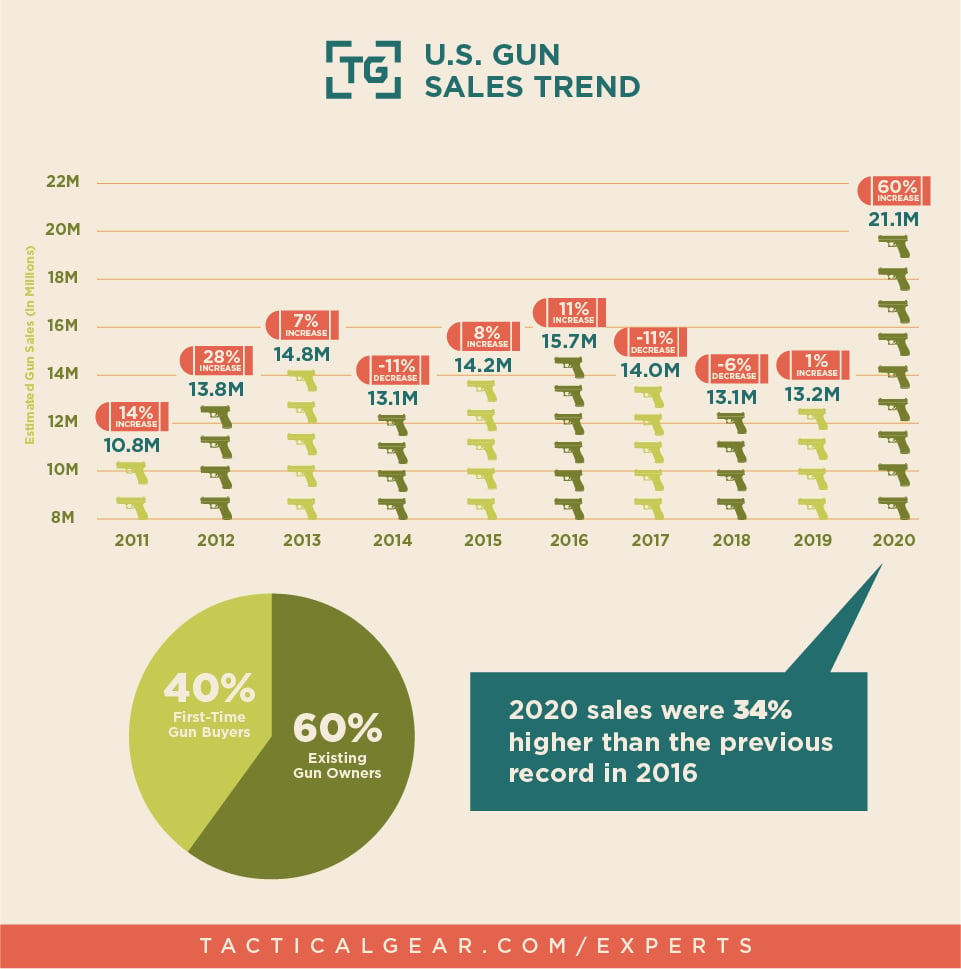
U.S. Gun Sales: 2011 - 2020
Share:
When you stack up the last 10 years of firearm sales in the United States, 2020 sticks out quite a bit from the rest. Sales figures from that year exceed those from the previous record holder, 2016, by 34%. The number of guns sold in 2020 was nearly twice the number of guns sold in 2011. Perhaps even more interestingly, 40% of the firearms sold in the United States in 2020 were purchased by individuals who had never owned a gun before.
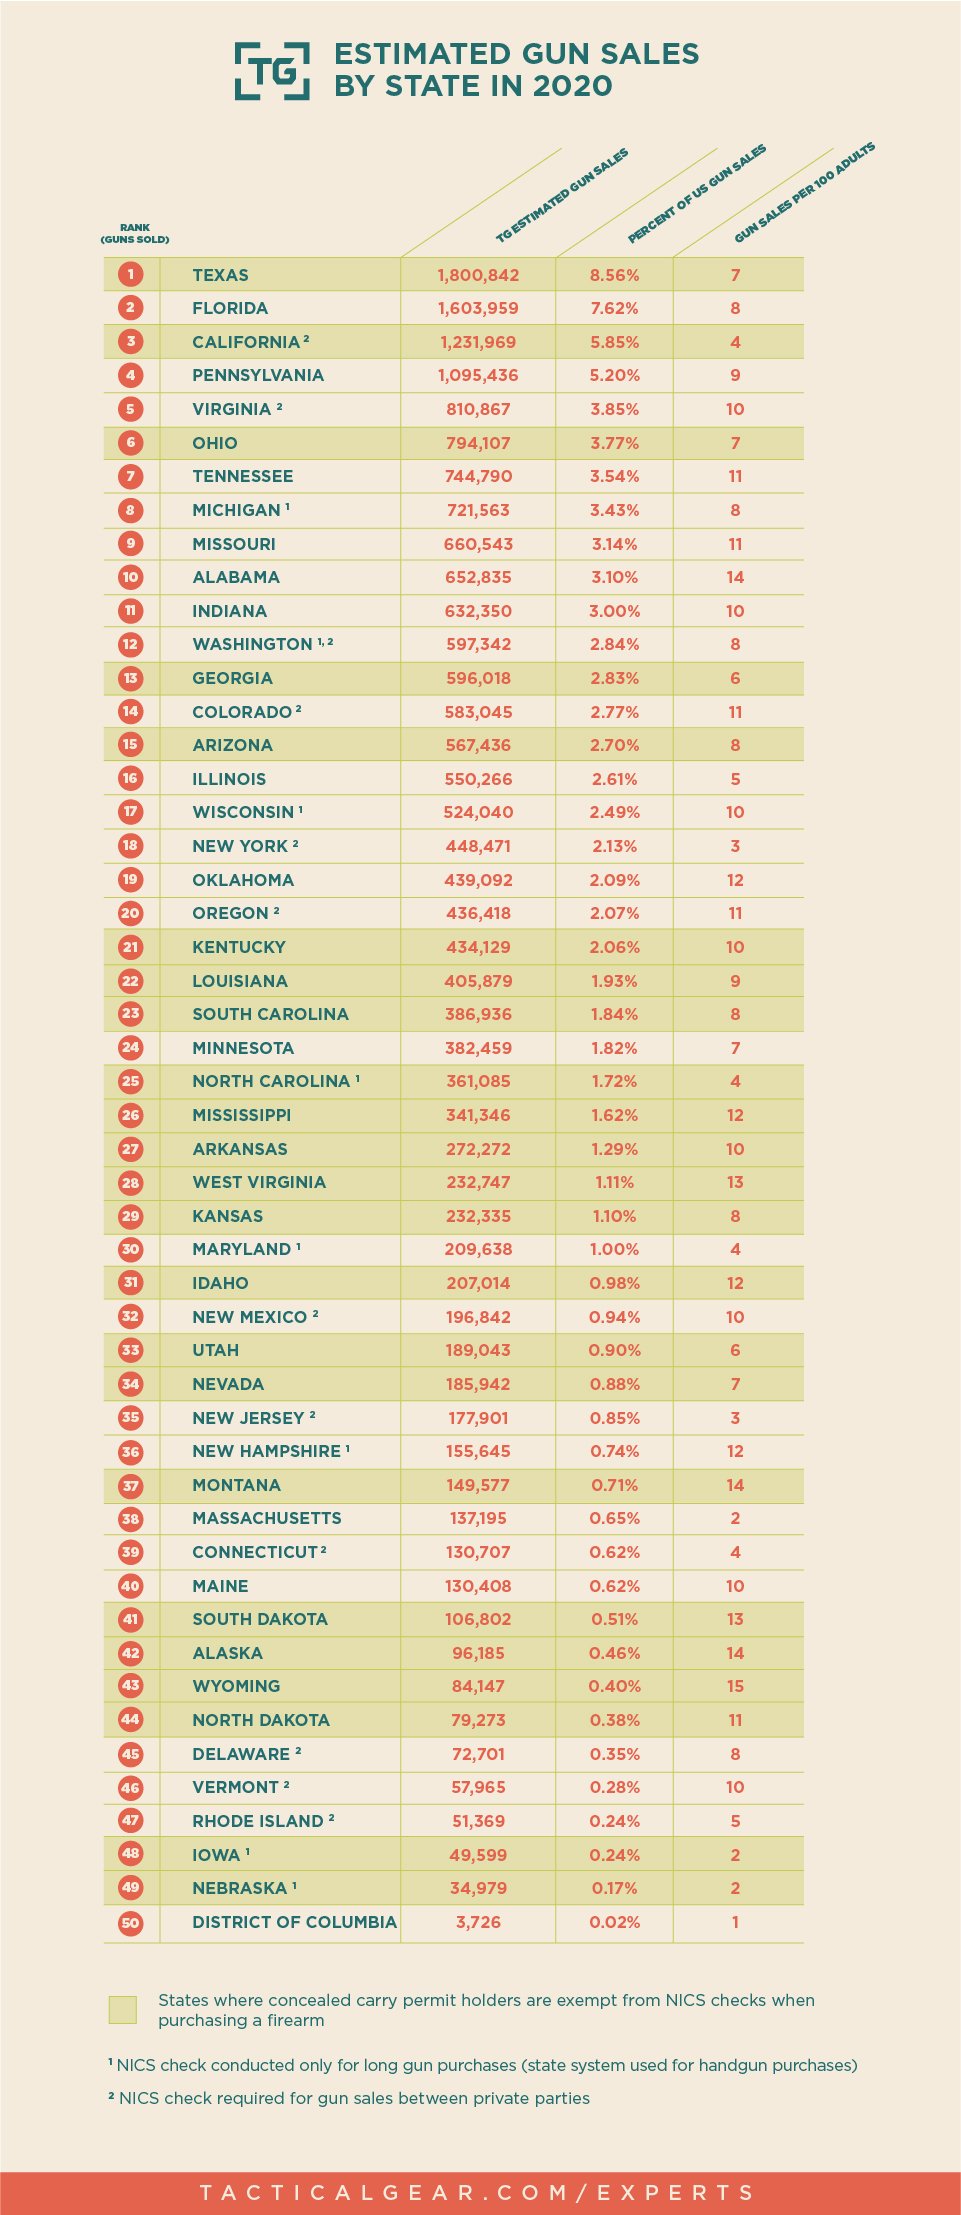
Estimated Gun Sales by State in 2020

Share:
Together, just five states accounted for almost a third of all the firearms sold in 2020. In Texas, the number of guns sold came close to topping 2 million. Florida, California and Pennsylvania all exceeded 1 million firearms sold, with Virgina trailing behind near 800,000.
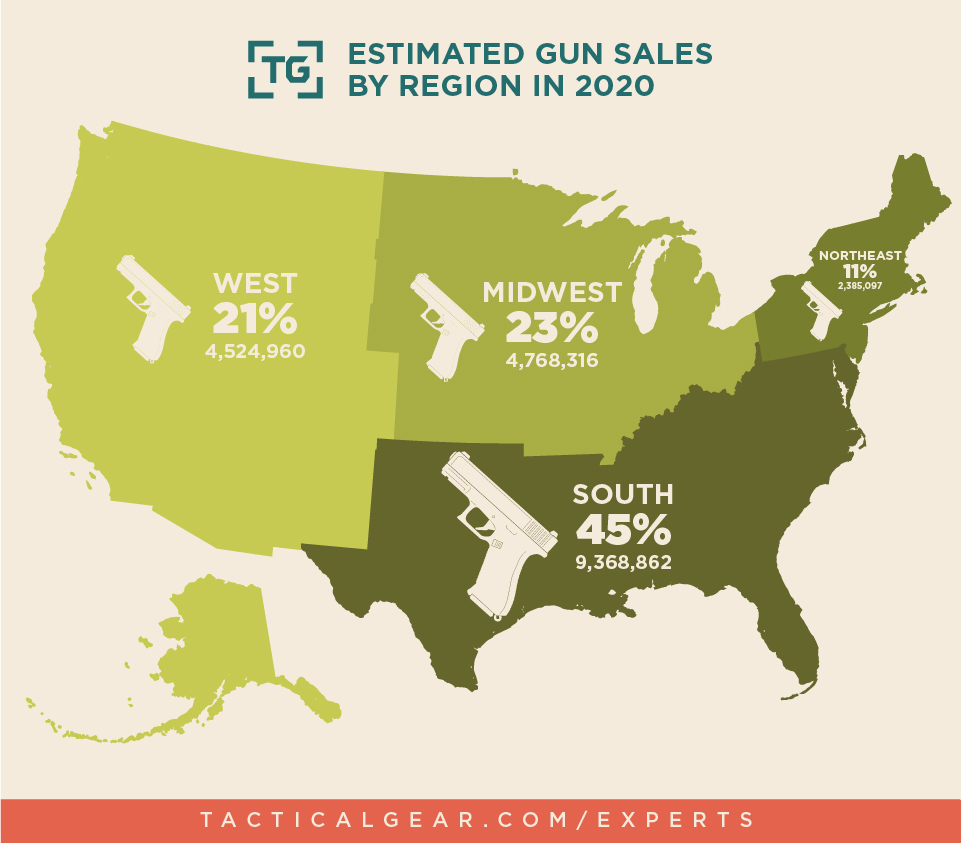
Estimated Gun Sales by Region in 2020
Share:
The South accounts for nearly half of all U.S gun sales in 2020. The Midwest and the West were very close at 23% and 21% respectively, with around a quarter million firearm sales separating them. Gun purchases in the Northeast fell firmly in last place at just 11%.
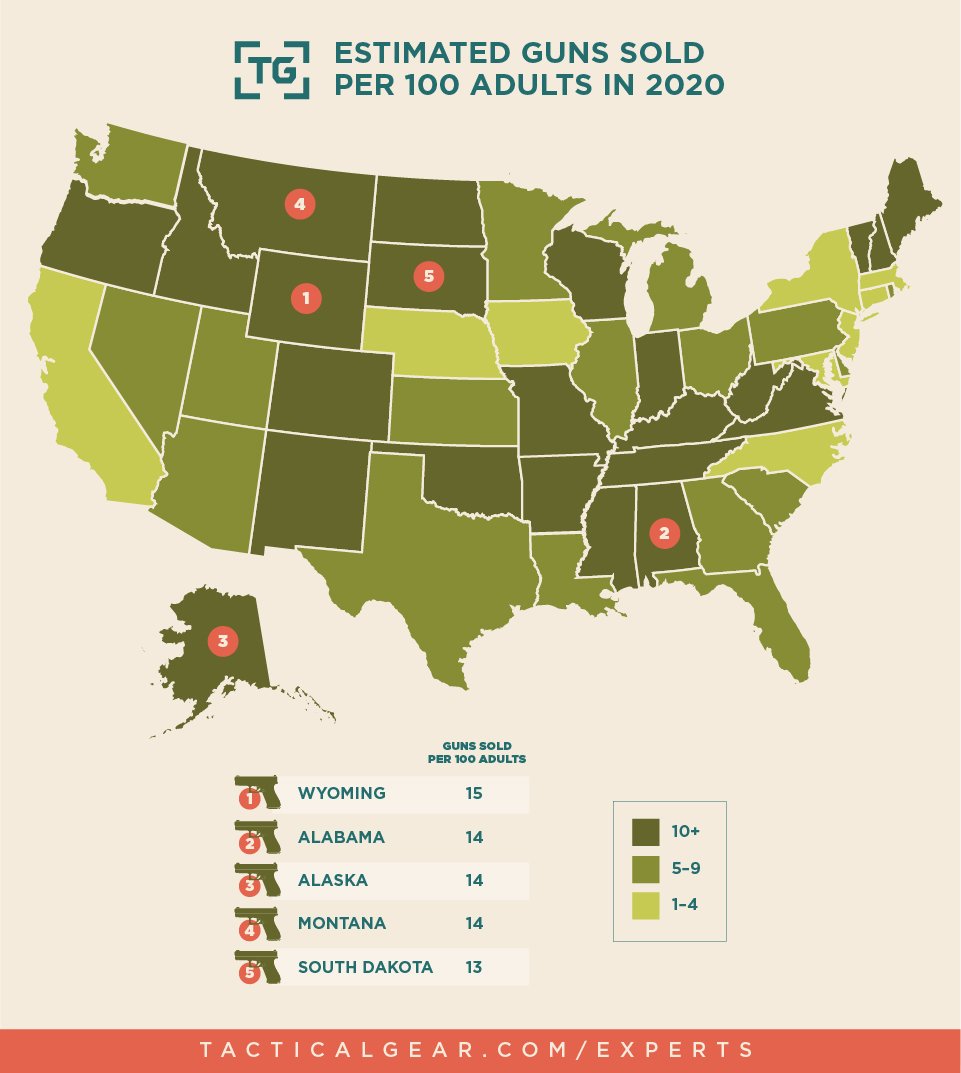
Estimated Guns Sold per 100 Adults in 2020
Share:
In the year 2020, there were 15 guns sold for every 100 adults living in Wyoming. Alabama, Alaska and Montana each tied for second place with 14 guns sold per 100 adults. Unfortunately, it's not possible to estimate the number of firearms purchased per buyer. However, if you were to assume an average of one gun purchase per buyer, that would indicate over 14% of the adult population purchased a firearm in these top four states last year.
State Rankings: Estimated Gun Sales by State in 2020
Share:
Methodology
Because the federal government does not track firearms sales, we used the FBI's National Instant Criminal Background Check System's 2020 report as the source for our estimates. We adjusted those figures to exclude NICS checks that were only for concealed-carry permit applications and concealed-carry permit rechecks, as they are not related to the sale of a firearm. We have also excluded U.S. territories and the state of Hawaii. You can view our dataset here. Our adult population size estimates are from the U.S. Census Bureau's July 2019 report.
While the NICS does offer the best approximation of U.S. gun sales per year, there isn't necessarily a one-to-one correlation between a NICS check and a firearm sale (i.e. 1 NICS check may not equal 1 gun sale). For instance, if an individual is buying three guns at once, they only require one NICS check.
It's also important to understand that, in 37 states (reflected in the chart in the previous section), NICS checks are not required for sales made between private parties, so those firearm sales are missing from the data. NICS checks are also not required in 25 states where a gun buyer already has a CCW permit; this means more missing sales figures for those states. In some states, NICS checks are only required for long gun purchases (instead, the state background check system is used for handgun purchases).
While the methodology isn't perfect, it's also not too far off from realistic firearm sales figures. It's also based on trackable data from millions of purchases. The result offers interesting insights from multiple perspectives into gun sales in the United States.
Share
Share:
Did you find this article helpful?
Related Articles
-
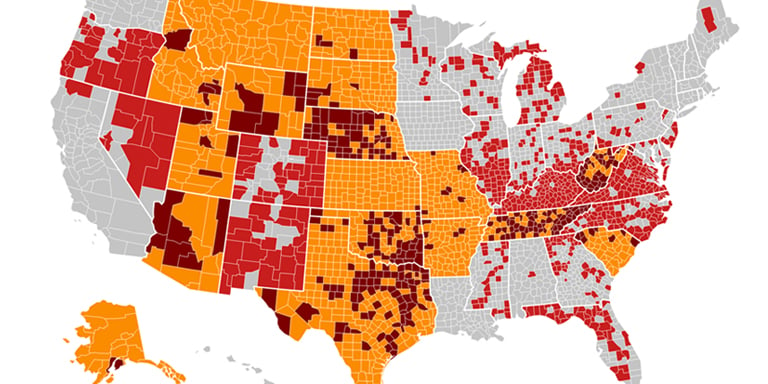
Second Amendment Sanctuary Reviewed: Every U.S. State and County
We cover the basics of Second Amendment sanctuary and detail the sanctuary status of every state and county, nationwide.
Regulations
157 others found this helpful -
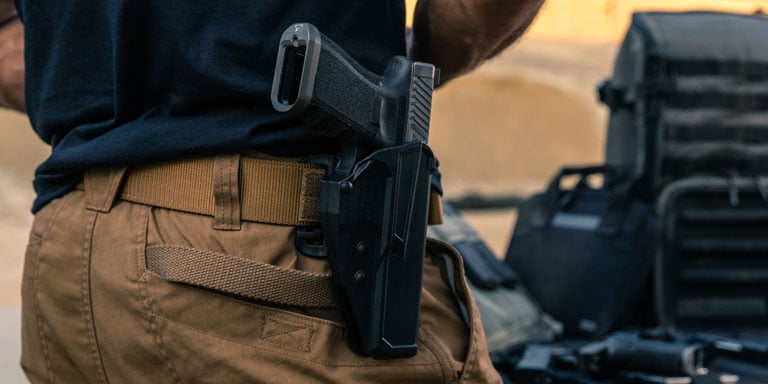
How to Choose a Gun Holster
Choosing a holster is no easy task. From retention methods to material, we'll help you find the right one for your gun.
Buyer's Guides
127 others found this helpful -
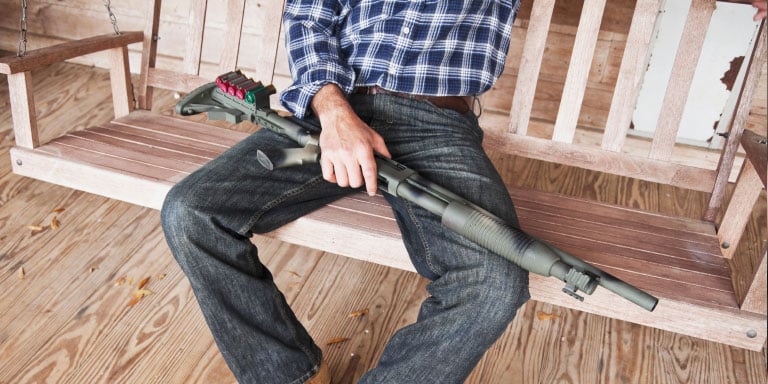
Why You Should Use a Shotgun for Home Defense
Looking for the perfect home defense weapon? Here’s our case for picking a shotgun as your weapon of choice.
121 others found this helpful -
Handgun Basics: Identifying parts and functions
Get a better understanding of handguns by learning to identify parts and functions both revolvers and semi-automatics.
110 others found this helpful -
U.S. Gun Sales Dashboard - Charts Updated Monthly
Our U.S. gun sales dashboard is updated every month to help identify trends in firearm sales data and statistics in America.
Regulations
106 others found this helpful -
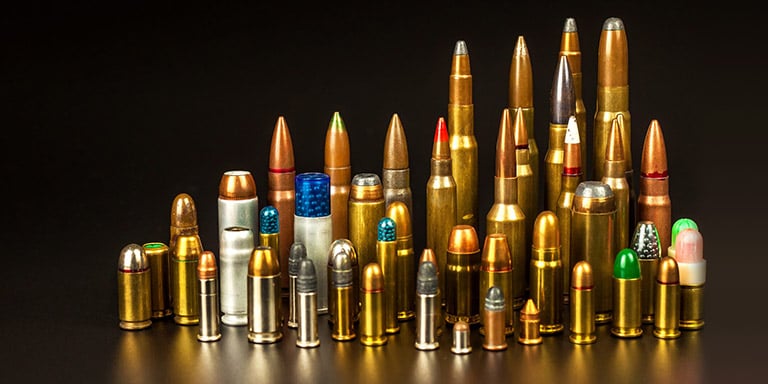
Ammo 101
Choosing ammo can be overwhelming, so we laid out the basics regarding the most common types of ammunition available.
Buyer's Guides
95 others found this helpful